P W A
AI-First Operations Platform

AI-Powered
Operations Agent
for Windows Fleets

Monitor, diagnose, and automate your entire Windows fleet from a single dashboard. 40+ built-in tools. Recurring tasks. Proactive watchdog. Interactive AI chat. MCP Server for Claude Desktop. Self-hosted on your own server.

Start Free Trial See How It Works
40+
Built-in Tools
5
Interfaces (Tray/CLI/Web/MCP/API)
.NET 9
Native Windows
agent.peopleworksservices.com
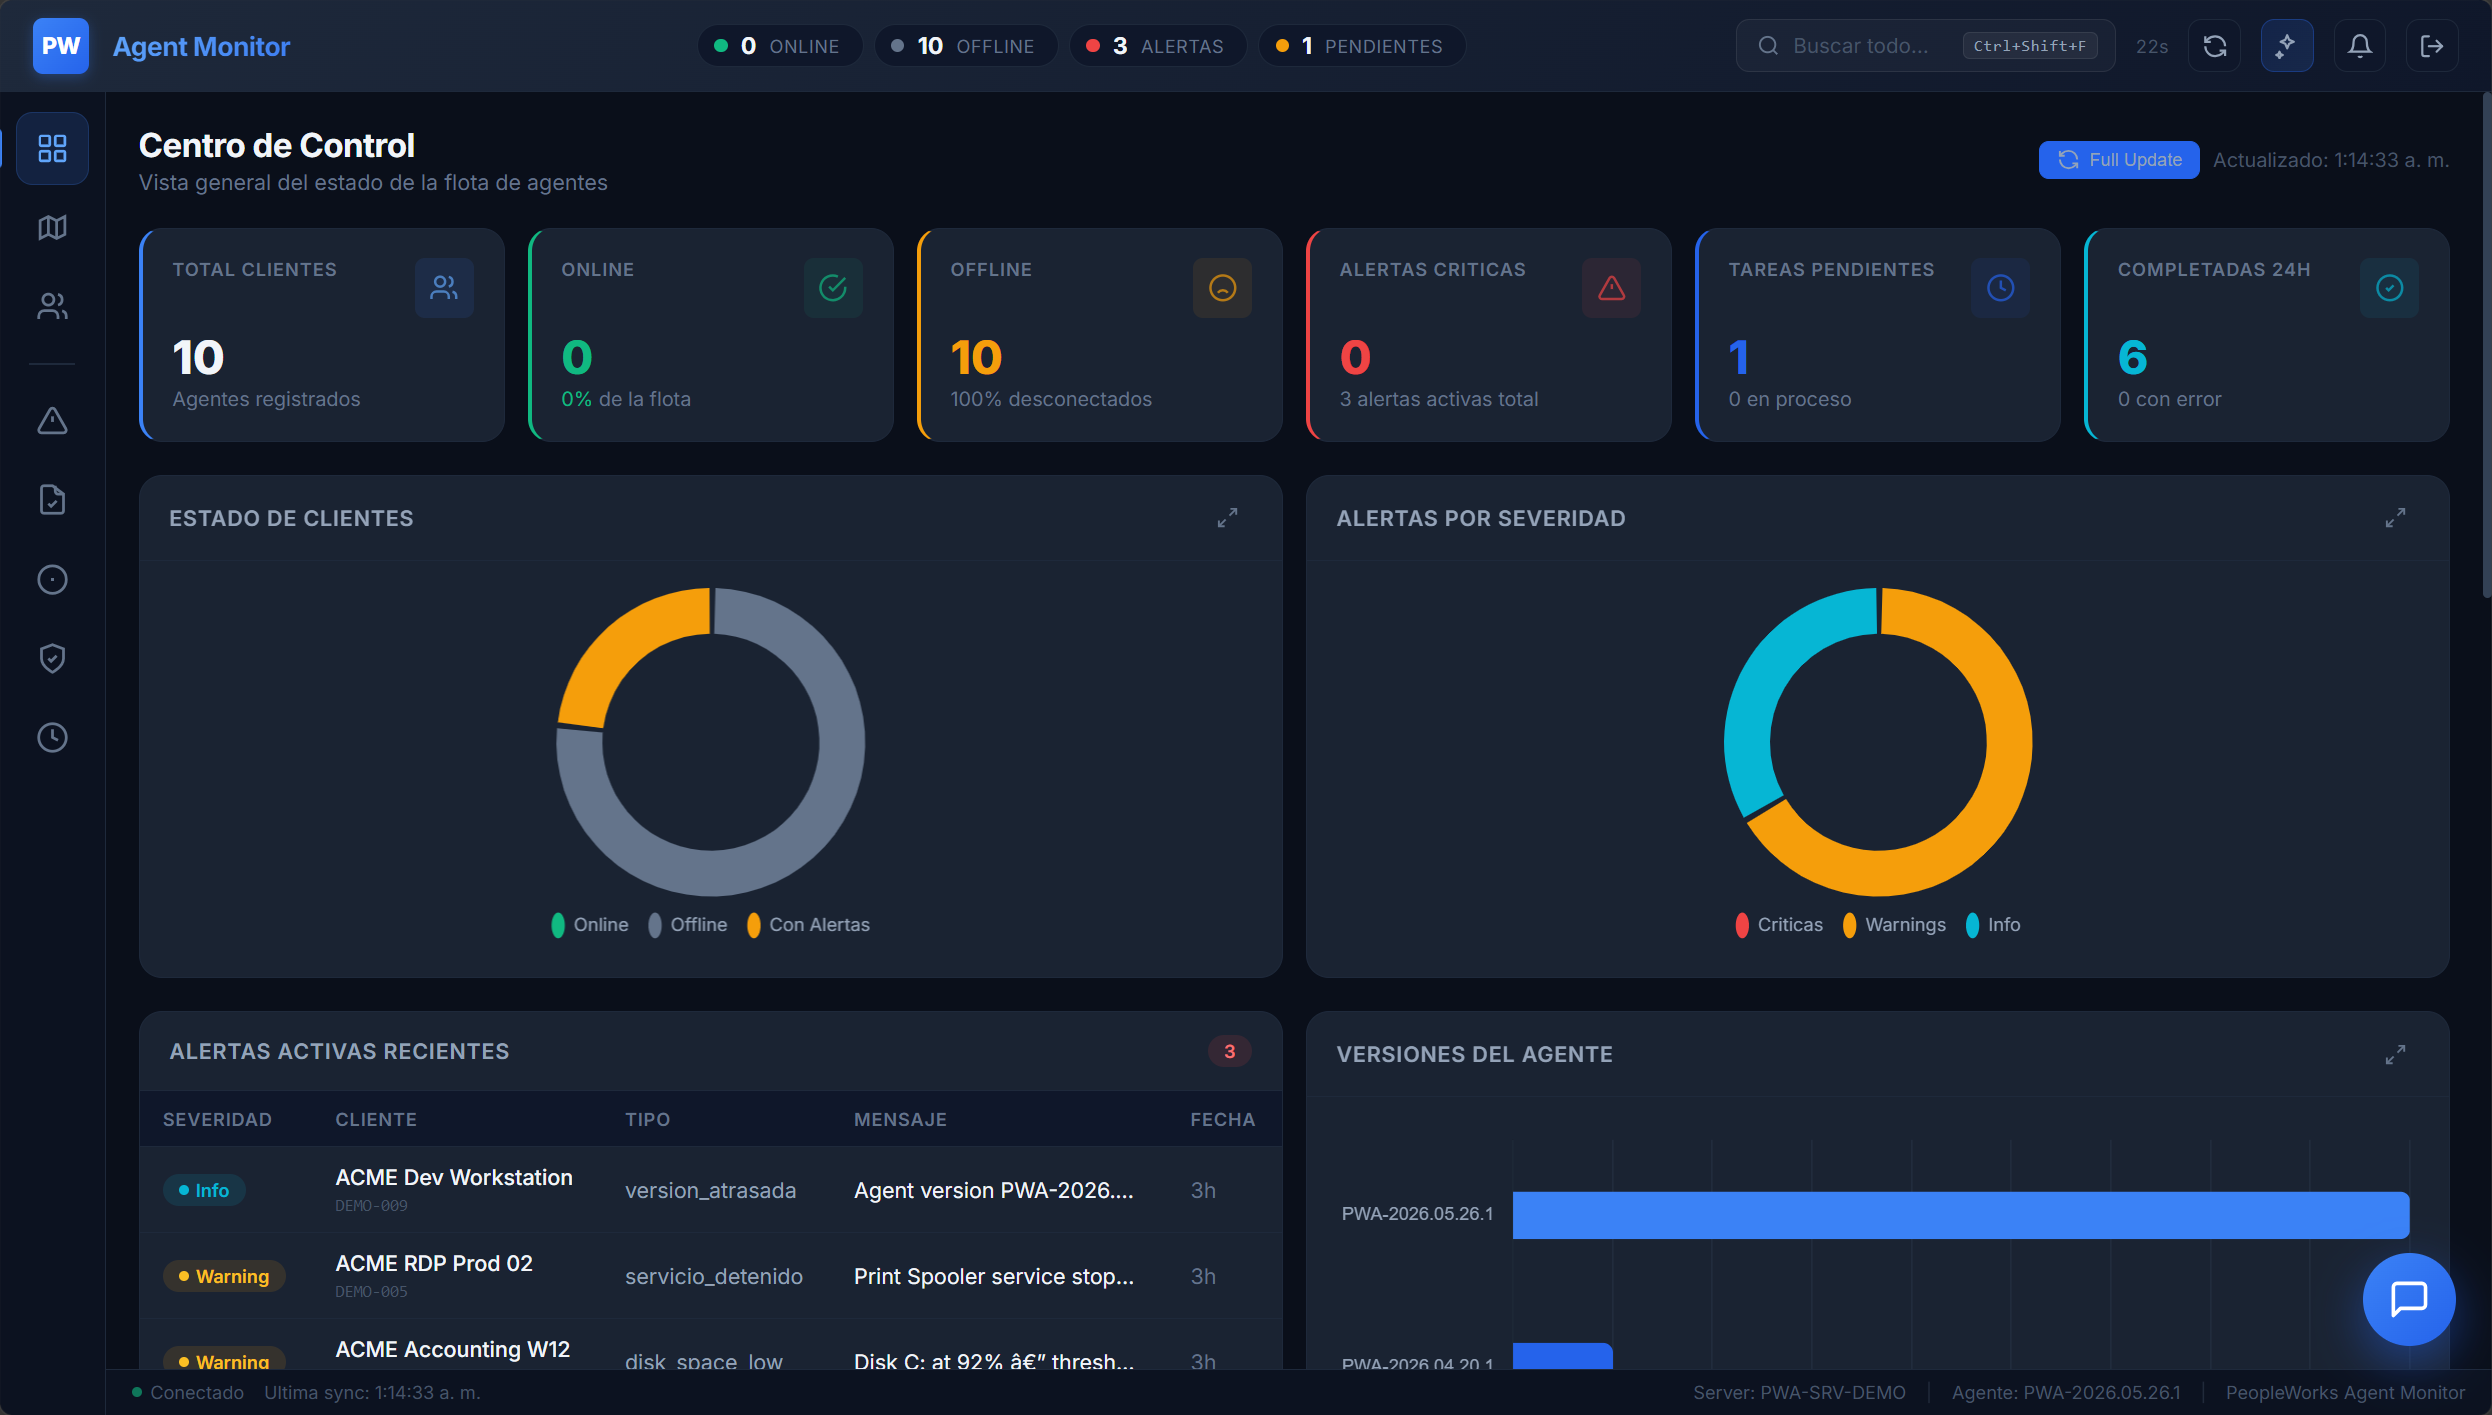
PWA fleet overview dashboard showing 10 hosts across workstations and servers, mix of online and alerting states
Platform Architecture

Five interfaces, one agent

Install once on each host. Then drive it from wherever you work — tray icon, web dashboard, CLI, Claude Desktop via MCP, or your own automation via the REST API.

Agent

WinForms tray app (.NET 9). Polls server for tasks. Runs the 40+ tools. Auto-updates via heartbeat. Adaptive polling.

Server

ASP.NET Core API. SQLite / SQL Server / PostgreSQL / MySQL. Multi-tenant. Hosts the web dashboard, REST API, and heartbeat endpoints.

Dashboard

Web UI for fleet operators. See all clients, dispatch tasks, view alerts, compare config snapshots, run playbooks.

CLI (pwa)

Console app with 18 commands. Create tasks, schedule cron jobs, run playbooks, chat with AI — all from the terminal.

MCP Server

Talk to your fleet from Claude Desktop. 40+ MCP tools exposed. STDIO + HTTP dual transport. AI workflows on top of operations.

See It In Action

Real screens, not mockups

Captured from a live PWA Server with synthetic ACME data. Same UI you get on day one.

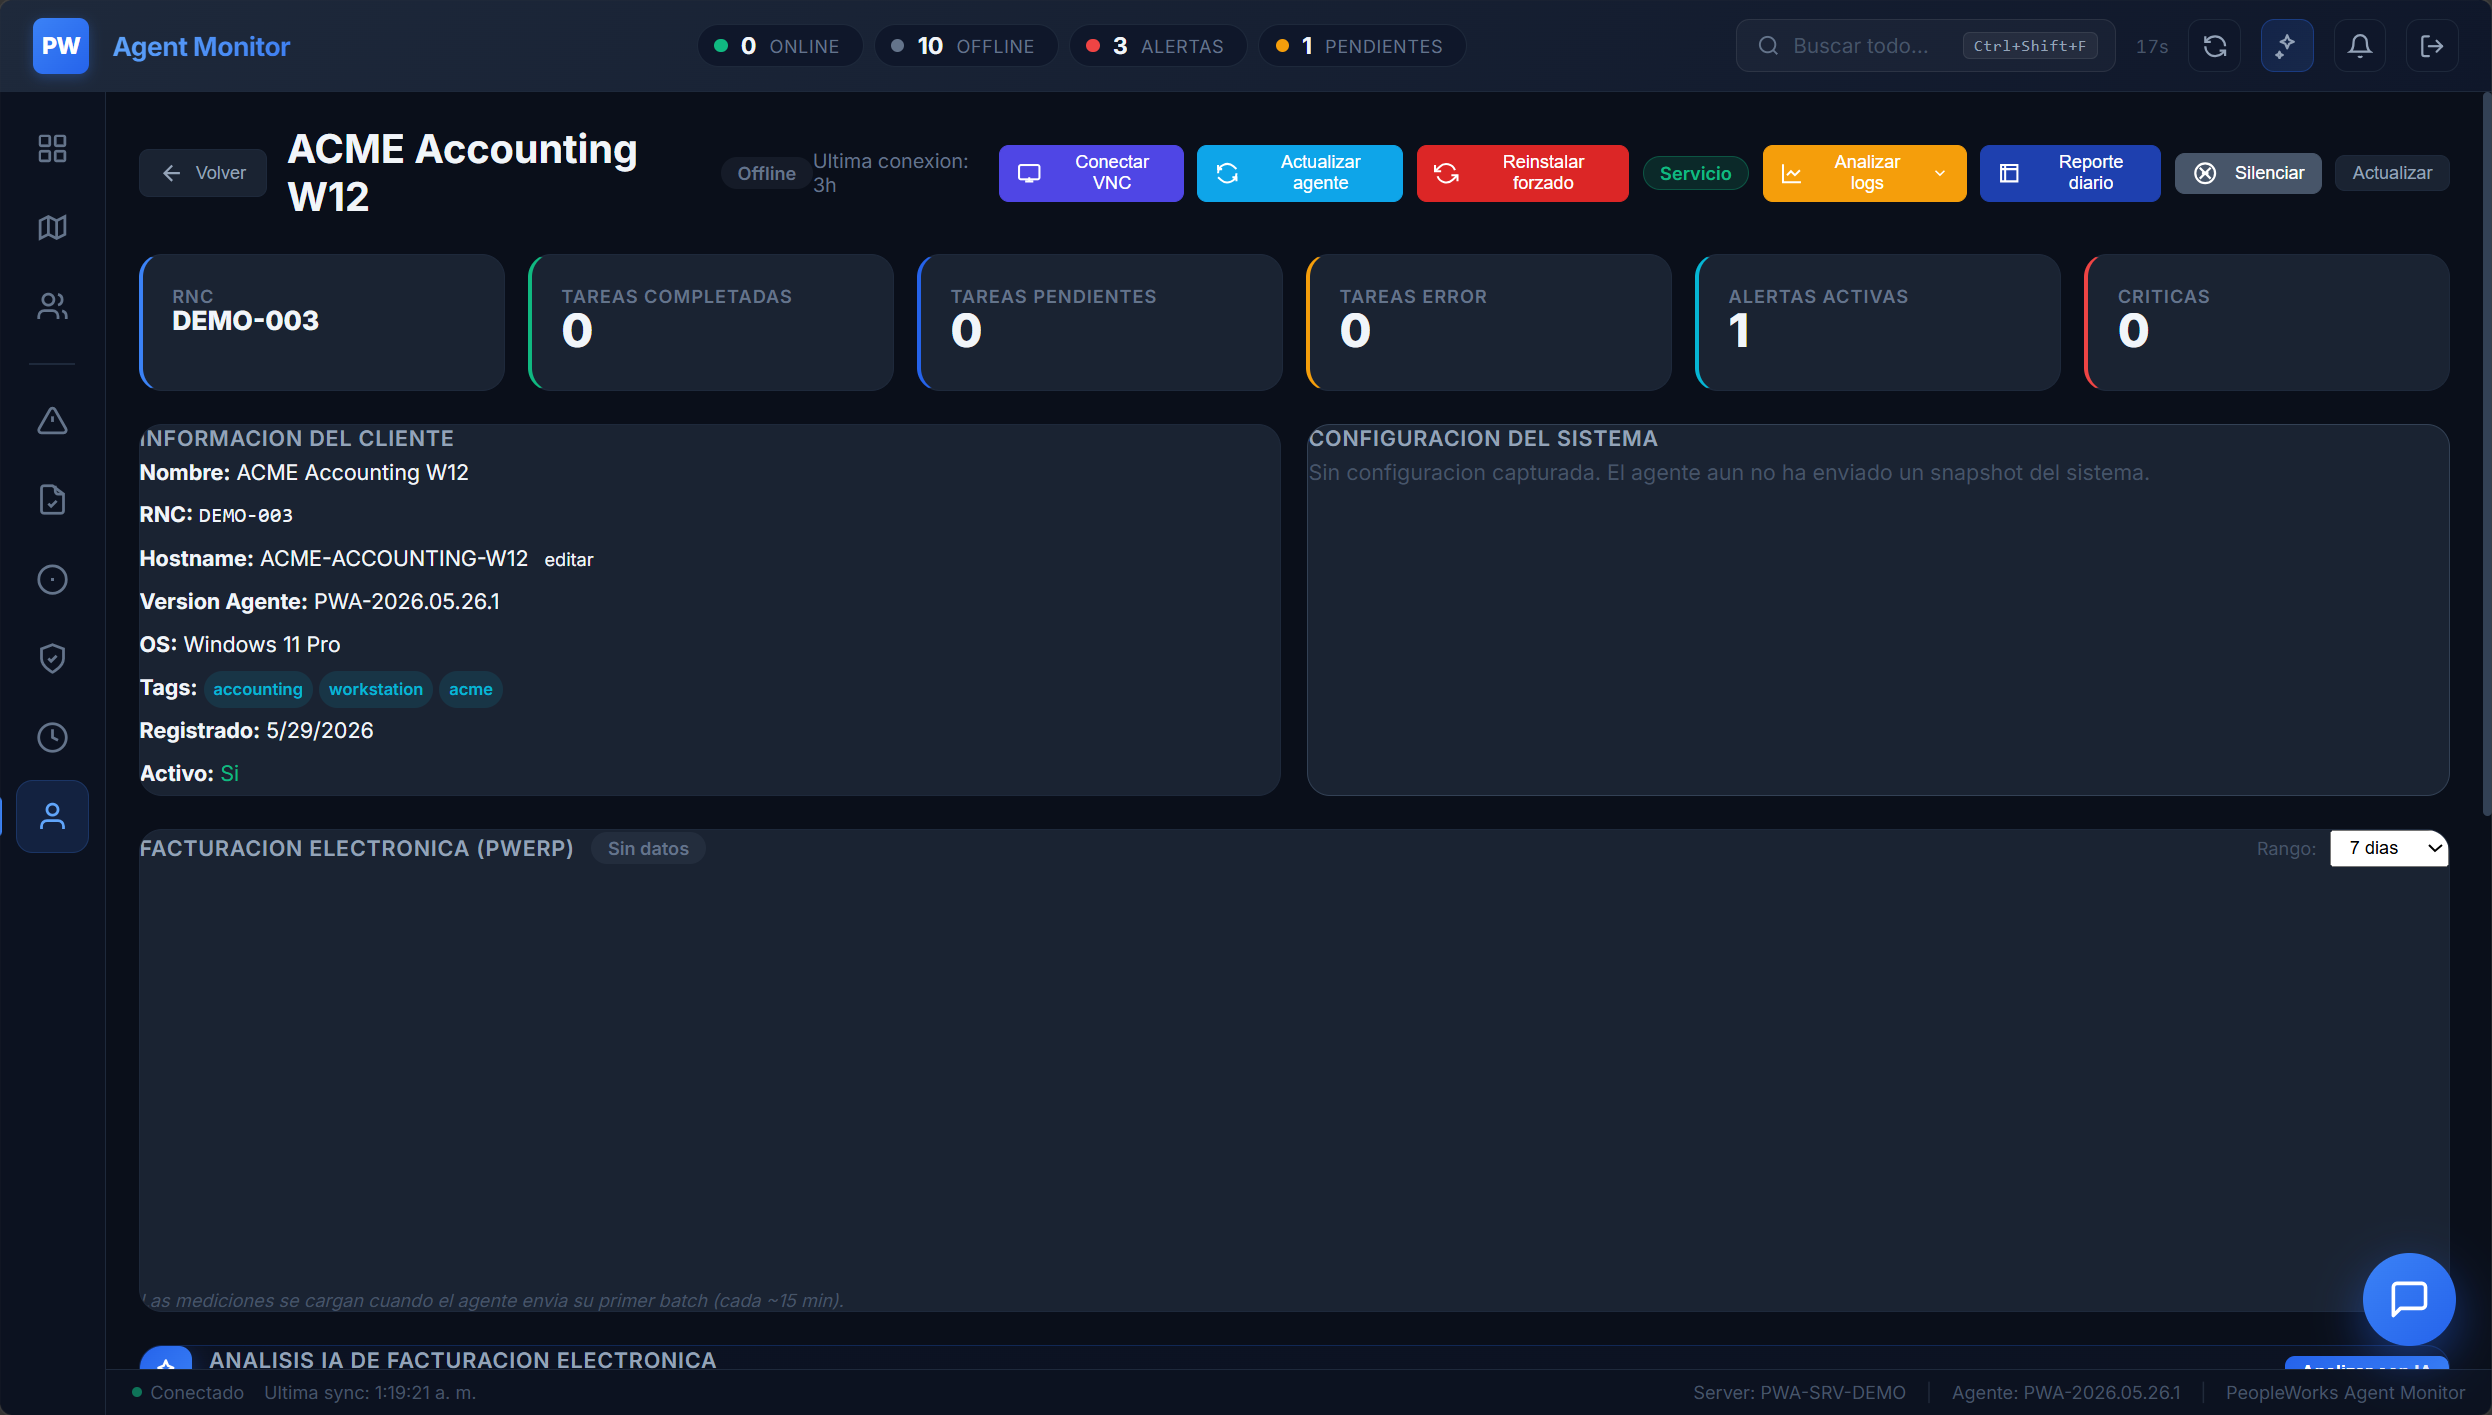
agent.peopleworksservices.com/host/DEMO-006
Detail view of a single host with tabs for tasks, alerts, configuration snapshots, and the agent's metadata

Drill into any host

One click takes you from the fleet grid into a full picture of any client: tasks (queued, in-flight, history), open alerts, configuration snapshots, agent metadata, tags. Everything in one tabbed view — no jumping between tools.

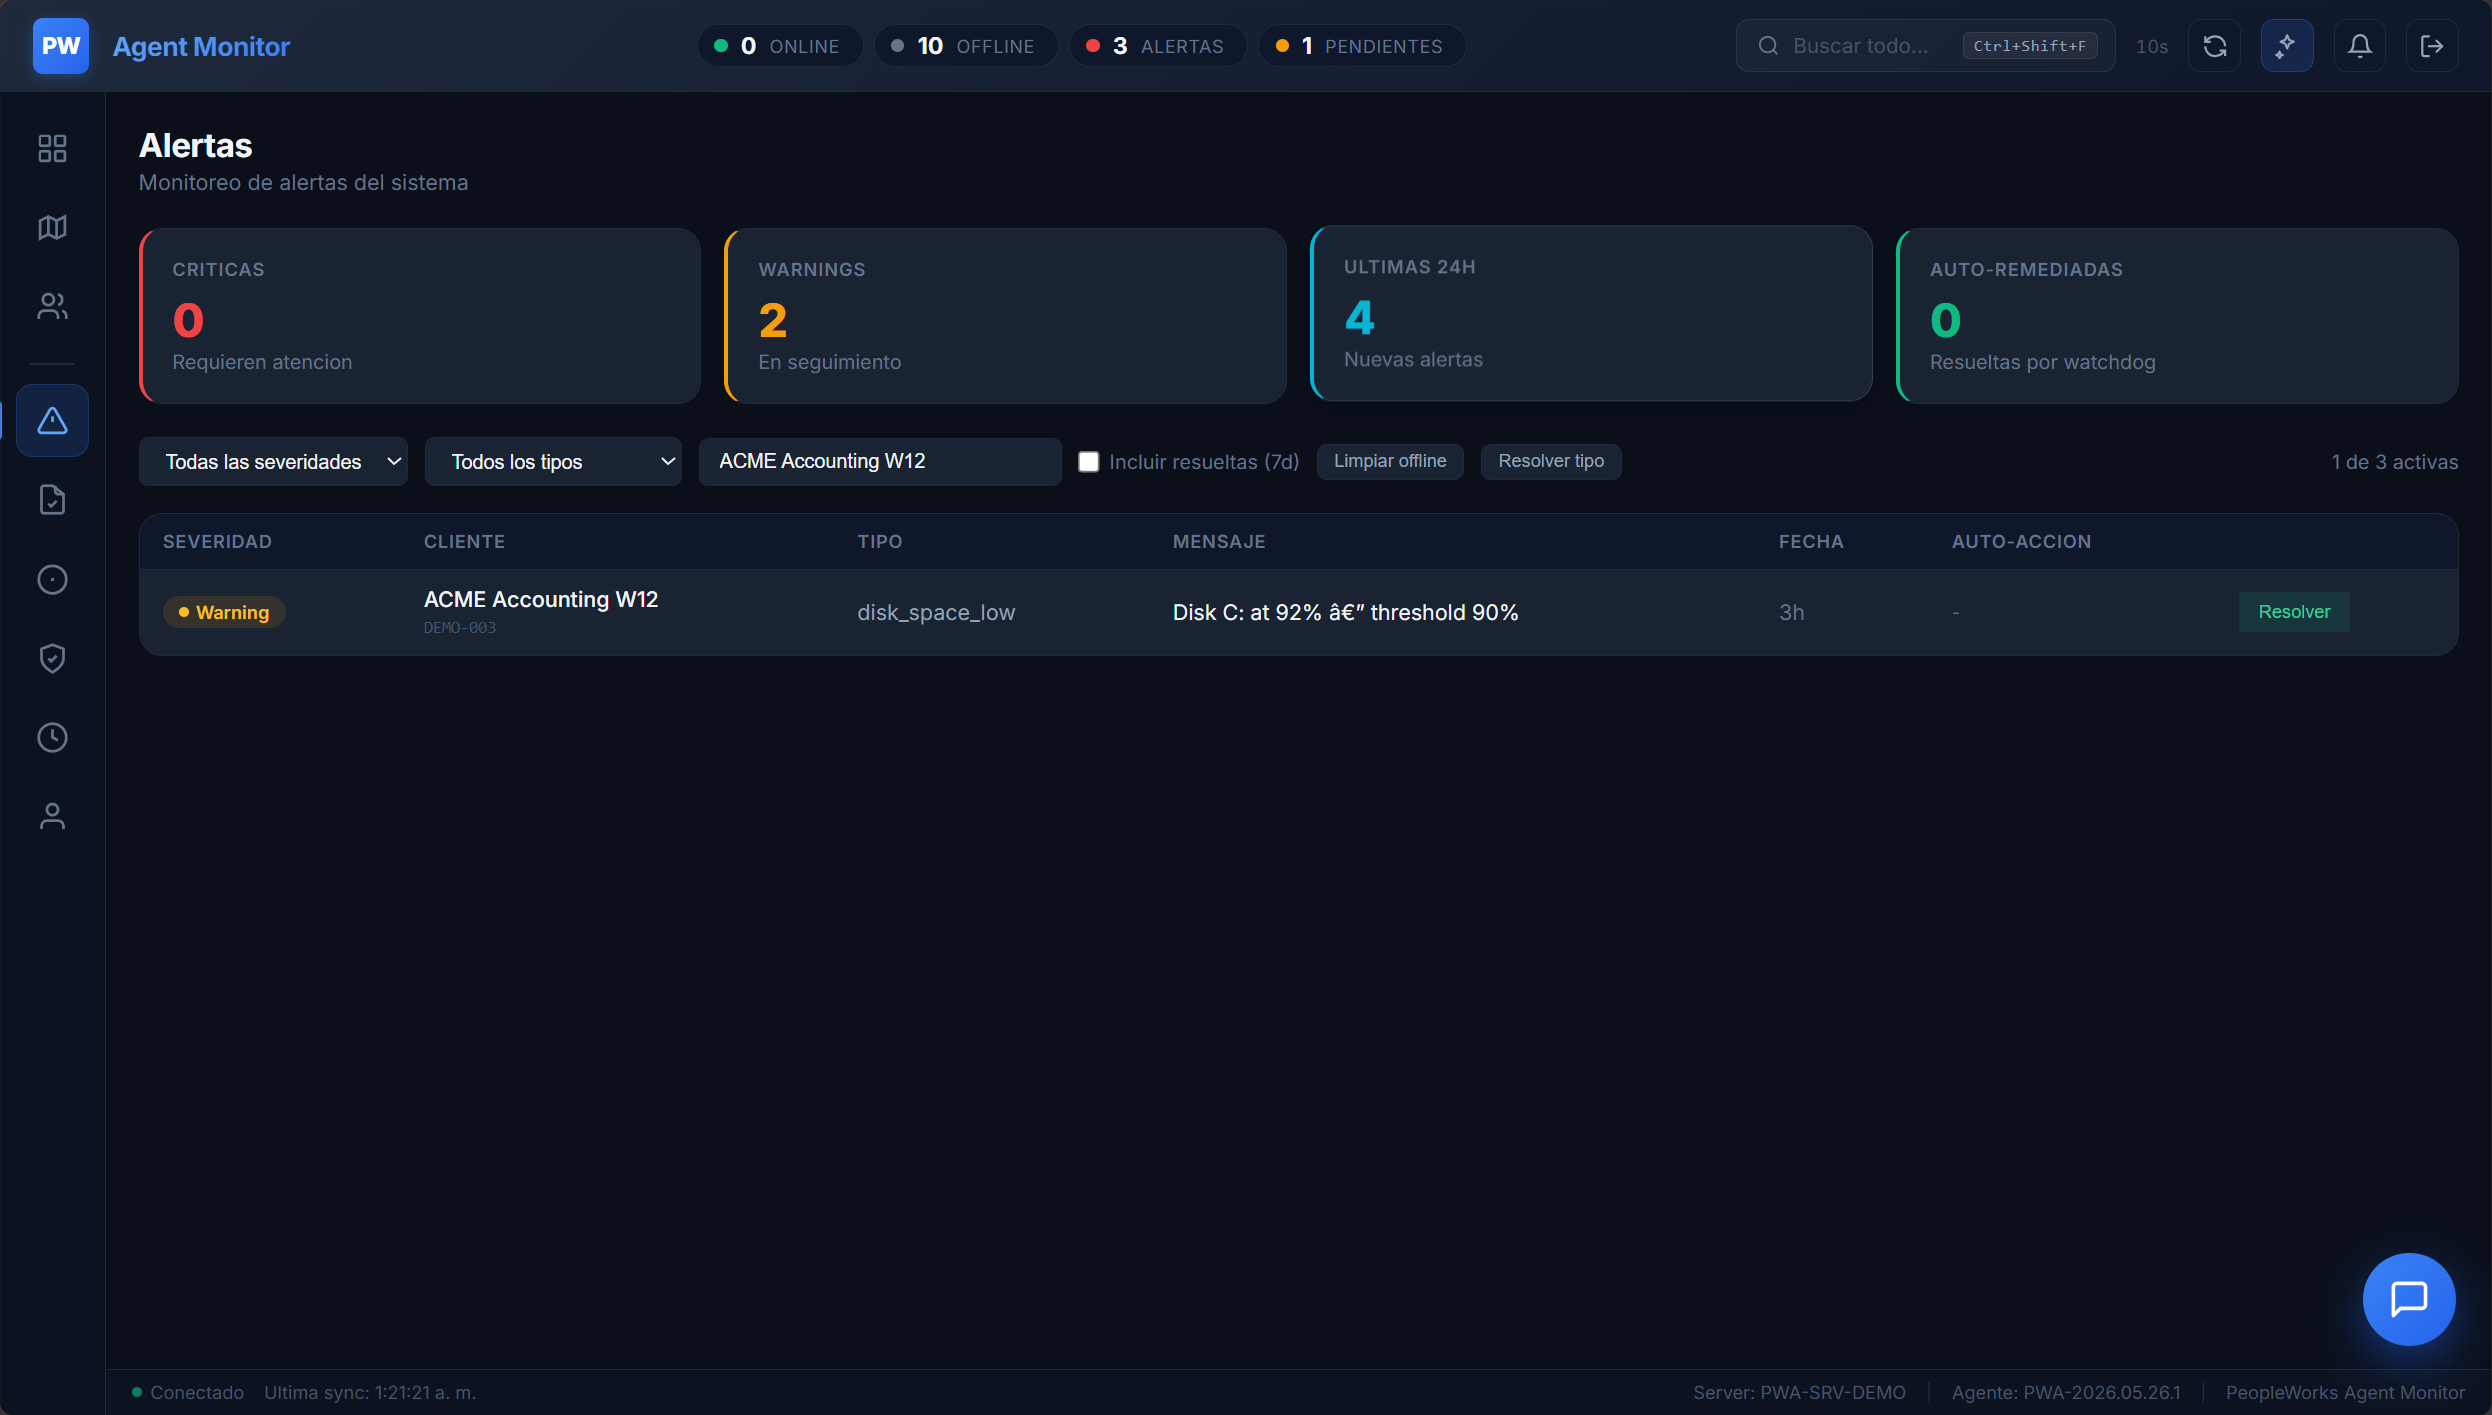
Alerts · 3 active · auto-remediation on
Alerts dashboard showing critical, warning, and 24h counts with the active alert table and auto-remediation status

Triage alerts in one screen

Severity counters at the top, the live alert table below. Filter by severity, type, or client. Mark resolved manually, or let the watchdog auto-remediate the ones with a known fix (the counter is right there).

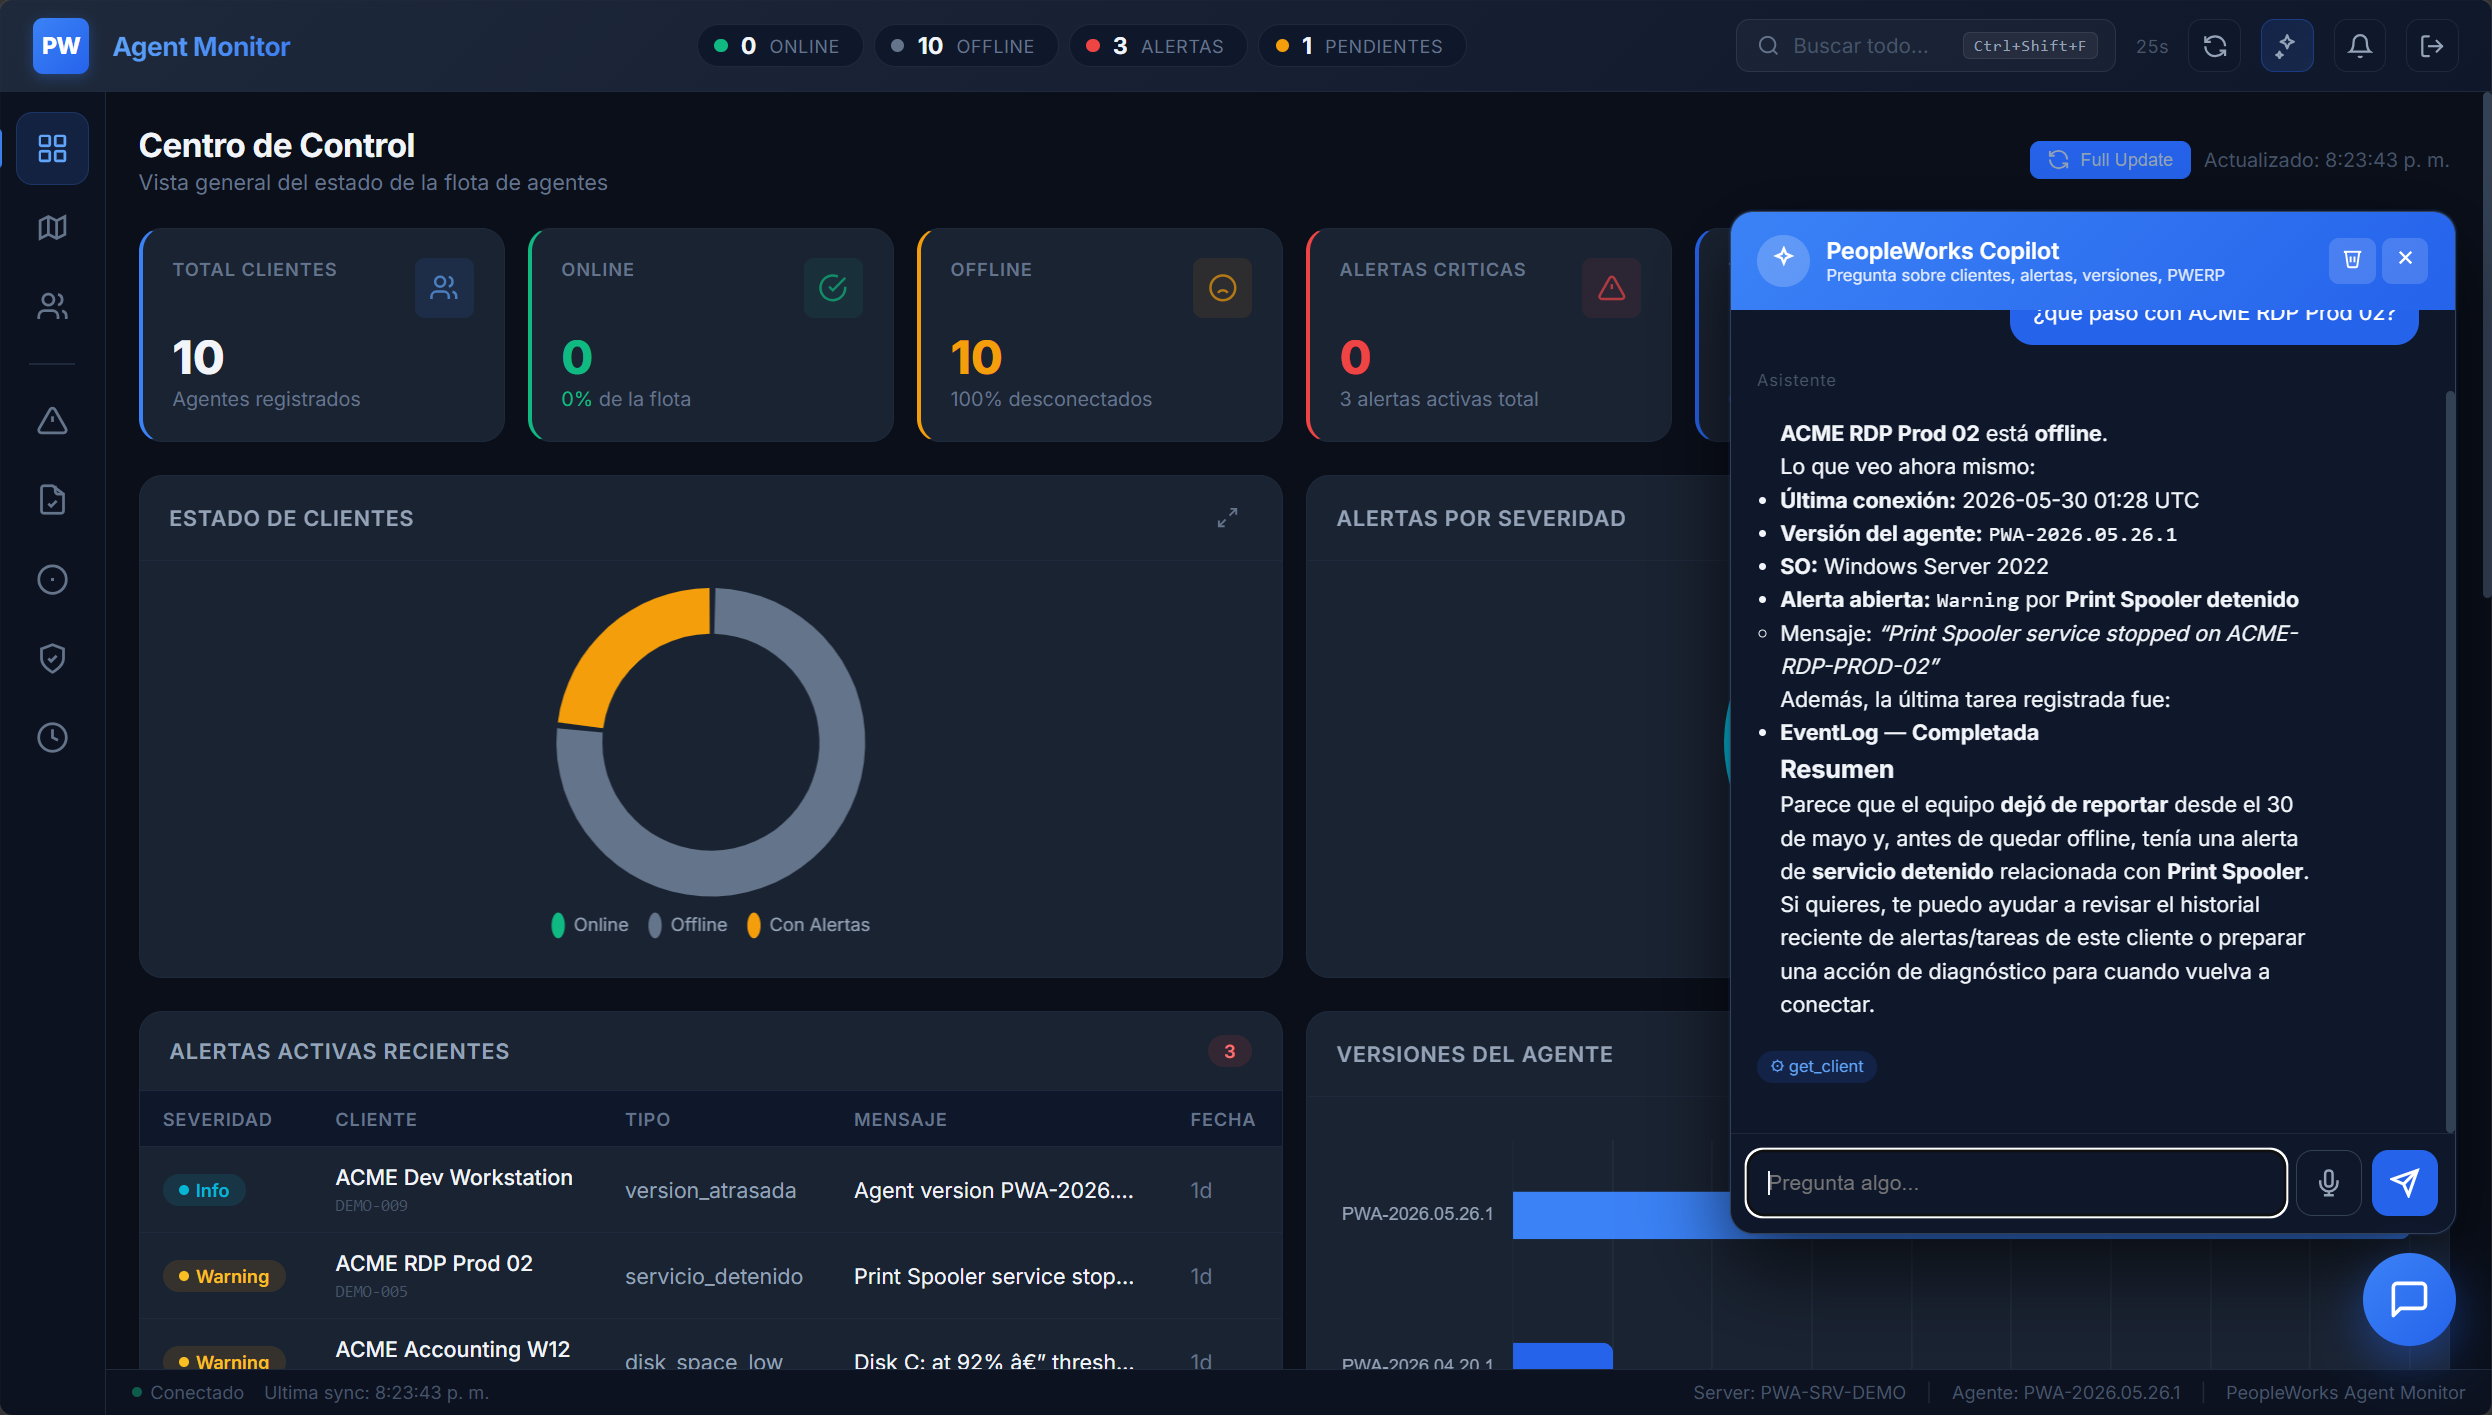
AI chat · tools enabled · in-context
AI chat conversation with the operator asking about critical alerts; the agent responds with a tool call listing active alerts and a suggested follow-up action

Talk to your fleet

Ask in plain language: "which hosts have critical alerts?", "show me yesterday's failed tasks", "restart the print spooler on the RDP server". The chat has the full toolkit at its disposal and tells you exactly which tool it called before acting.

Playbook · Morning Health Check · running
Playbook execution view showing a multi-step health-check sequence with per-step status, target hosts, and timing

One-click runbooks

Package the steps your team always runs at 8am — disk check, service inventory, SQL health, top processes — into a named playbook. Trigger across all hosts or a tag with one click. Every step has its own log, so you can audit and re-run individual steps without restarting the whole sequence.

On The Go

Fits in your pocket

The dashboard is responsive — open it from your phone, triage alerts on the train, send a task to a host while you're at lunch. Same PIN, same operations, same audit trail.

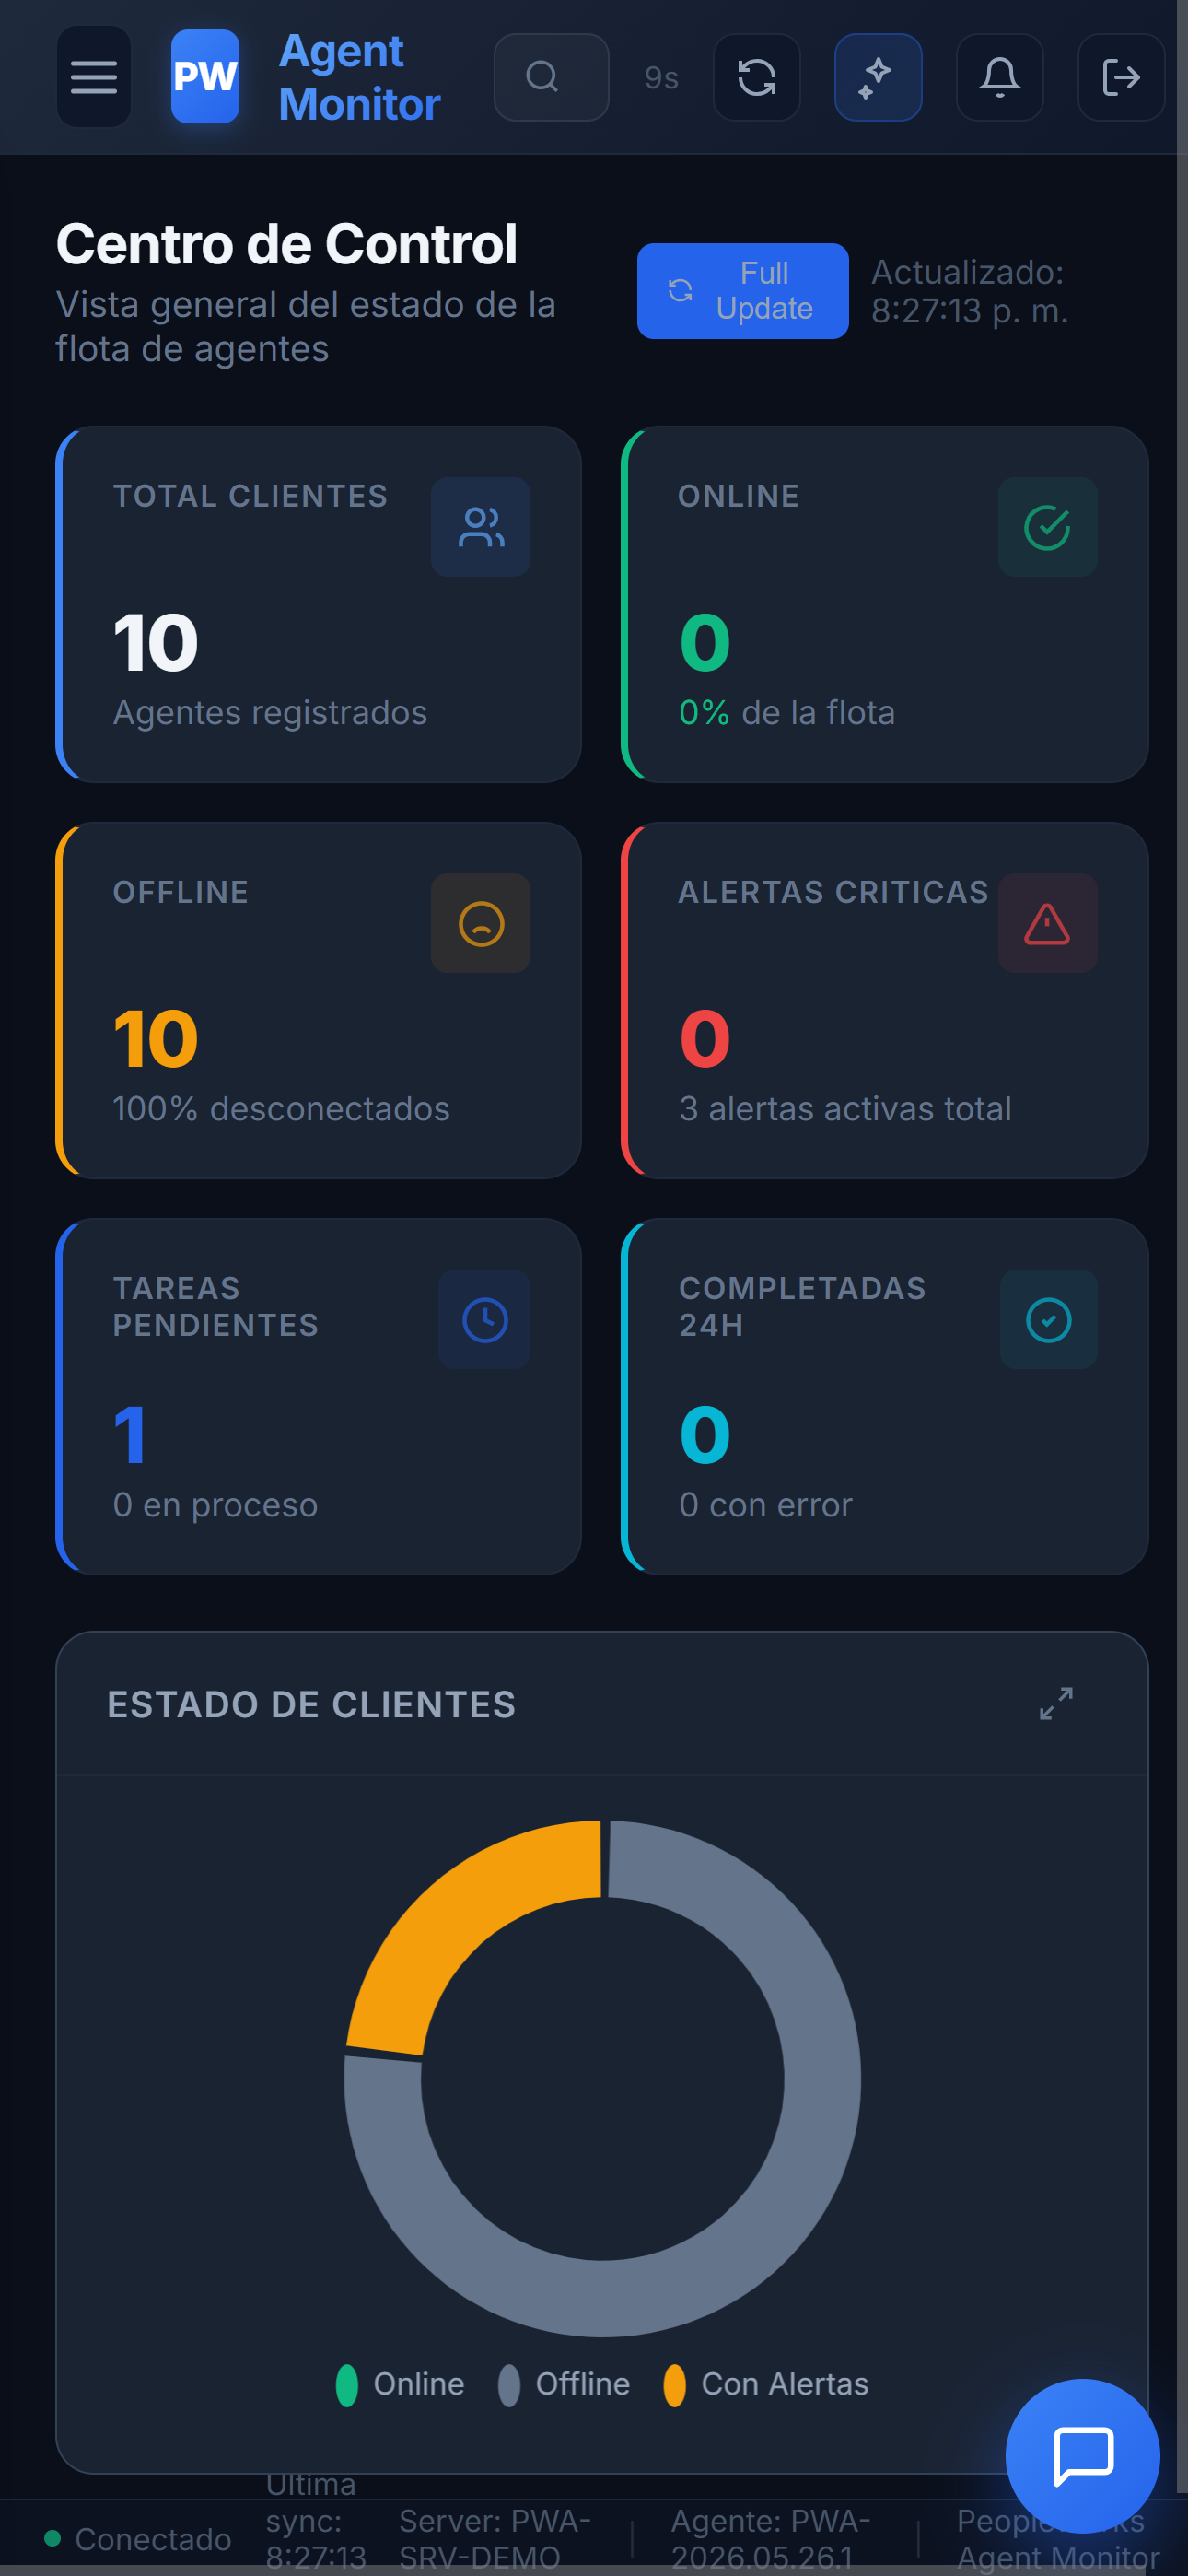
PWA dashboard rendered on a phone viewport, fleet overview cards stacked vertically with active alerts visible
Built-in Toolkit

40+ tools, ready out of the box

Every tool is callable from the dashboard, CLI, or AI. Each runs as a structured task and returns a verifiable result.

System Info

CPU Info

Memory Info

Disk Space

.NET Check

Version Check

Installed Software

Find App

File Check

Directory List

File Search

File Copy

Process List

Top Processes

Windows Services

Scheduled Tasks

Collect Logs

Event Log

Analyze Logs (AI)

Capture Screen

Network Info

Ping

Port Check

RDP Sessions

SQL Server Info

SQL Server Health

PostgreSQL Health

ODBC Drivers

Temp Cleaner

PowerShell

Memory Optimizer

Registry Read

 Plus FTP, VNC remote access, agent auto-update, install-as-service, refresh config — and your own custom tools via the IAgentTool plugin pattern.

Automation Engine

Set it once. Let it run.

PWA isn't just a remote terminal — it's a scheduler, a watchdog, and a workflow runner. Every action you take manually can become a recurring job.

Recurring Tasks

Full cron expressions via NCrontab. Daily snapshots, weekly cleanups, hourly health checks — all visible and editable from the dashboard.

Watchdogs

Background services that flag offline agents, correlate related incidents, gate alerts during snooze windows, and dedupe by (host, rule) so flapping conditions don't flood inboxes.

Playbooks

Predefined task sequences. "Morning health check", "Pre-update audit", "Incident snapshot" — chain tools into reusable workflows.

Bulk Operations

Dispatch a task to one host, many hosts by tag, or your entire fleet at once. Track progress per-host in real time.

Config Snapshots

Capture host configuration every 6h or on-demand. Compare snapshots between dates or between hosts to spot drift instantly.

Smart Alerts

Threshold + change-based alerts. Daily summary email. Telegram channel push. Per-client cooldowns to avoid spam.

Adaptive Polling

Agent polls every 30s when active, then backs off to 60s / 2m / 5m / 10m when idle. Saves bandwidth without sacrificing responsiveness.

Auto-Update

Each heartbeat carries the agent's version. If the server has a newer binary, the agent pulls and self-updates — no manual rollout.

AI Integration

Operations meets your AI of choice

PWA isn't a black-box AI product — it's a fleet of structured tools that any LLM can drive. Bring your own AI provider, talk to your hosts in natural language, or expose everything to Claude Desktop via MCP.

Interactive AI Chat

Ask "why is CLIENT-23 slow?" — the chat pulls live context (CPU, memory, top processes, disk), reasons over it, and either gives you the answer or dispatches a diagnostic task. Available in the CLI (pwa chat) and the dashboard.

  • Per-client context injection
  • Triggers tools mid-conversation
  • Provider-agnostic (any OpenAI-compatible API)

MCP Server for Claude Desktop

40+ PWA tools exposed via the Model Context Protocol. Open Claude Desktop, ask "check disk space on all production servers", and Claude dispatches the task across your fleet, then synthesizes the answer.

  • STDIO + HTTP dual transport
  • ModelContextProtocol v1.0+
  • Auto-discovery via [McpServerTool] attributes
$ pwa chat --rnc CLIENT-001
You: Why is CLIENT-001 slow this morning?
PWA: Checking now. Pulling live snapshot…
→ cpu_info, top_processes, memory_info
PWA: CPU sustained at 87%. 3 instances of PWERP.EXE consuming 71% combined. Free memory: 412 MB. Suggest killing the orphan copies — the guardian will respawn them if they're legitimate.
You: Kill them.
PWA: Dispatched erp_guardian in cleanup mode. Result pending. ETA 15s.
Built for Fleets

One server. Every host. Logically separated.

Each host is a client identified by its own key. Group them by tag, customer, environment, or region. PWA scales from one machine to hundreds.

Tag-based grouping

Organize clients by environment (prod/staging), customer, region, or any custom dimension. Dispatch tasks per tag in one click.

Heartbeat-based health

Every agent pings the server. The dashboard shows online/offline, last-seen, version, and surface vitals at a glance.

Remote view (VNC)

Need to actually see what's happening? Start an on-demand TightVNC session from the dashboard. No pre-installation required.

Per-client configuration

Email destination, tags, snooze windows, location, support flags — configured per client and stored alongside the rest of the fleet state.

Your DB, your choice

Server runs on SQLite (zero-config), SQL Server, PostgreSQL, or MySQL. Bring your existing infrastructure.

White-label ready

Replace the brand, the colors, the product name. Run PWA under your own identity for your own customers.

Pricing

Start free. Scale when you need to.

No per-tool fees. No per-task limits. Pricing is based on the number of hosts you manage.

Starter

Single host, kick the tires.

$0
forever
  • 1 host
  • All 40+ built-in tools
  • Manual + scheduled tasks
  • Local dashboard
  • CLI (pwa) access
  • Community support
Get Started

Enterprise

Custom deployments, your brand.

Custom
contact sales
  • Unlimited hosts
  • Everything in Professional
  • White-label branding
  • On-prem deployment
  • Custom tools (IAgentTool plugin)
  • Dedicated PWA Server instance
  • SLA + priority support
  • Implementation services
Contact Sales

Ready to put your fleet on autopilot?

Get a guided demo with the full platform — dashboard, CLI, MCP, AI chat, the whole thing. See how PWA fits your operations in 30 minutes.

Agent

WinForms tray app — your eyes and hands on each host

What it is

A single-binary .NET 9 WinForms app (PeopleWorksAgent.exe) that runs on every host you want to monitor. Installs in seconds, no IIS, no SQL Server, no .NET Framework, no Java. Self-contained.

Two run modes

How it polls

The agent polls /api/{tenant}/tareas/pendientes on a schedule. Adaptive polling ("Modo Receso") slows the cadence when the host is idle to save bandwidth:

active   → 30s
quiet 1m → 60s
quiet 5m → 2m
quiet 15m → 5m
quiet 1h → 10m

A single command from the dashboard wakes the agent back up to 30s immediately.

Self-update

Every heartbeat carries the agent's version. If the server's latest.json says a newer build is available, the agent downloads it, swaps the binary, and restarts — no manual rollout across the fleet.

Tip: Use publish-all.cmd to produce the single-file portable agent. Drop it on a USB or share, point it at your server with --apikey TENANT_ID, and it's live.

Server

ASP.NET Core API — the brain of the fleet

Stack

ASP.NET Core 9. Single binary, runs on Kestrel standalone, IIS, behind nginx, or in Docker. Your call.

Storage

EF Core with provider-of-your-choice. SQLite for zero-config / single-host setups, SQL Server / PostgreSQL / MySQL for production. Same schema, same migrations, no code changes.

Endpoints

Per-client scoping

Every endpoint is scoped by a client ID (in PWA's reference deployment that's the RNC, but the field is just an opaque string for white-label use). Data is logically separated by client — tasks, snapshots, alerts, and metrics all carry the client foreign key. The server enforces rate limits and security headers globally via middleware.

Dashboard hosting

The server also serves the web dashboard from wwwroot/. Auth via PIN middleware for operators; agent endpoints whitelisted via API key.

Dashboard

Web UI for fleet operators

Fleet at a glance

One view of every host. Online/offline status, last-seen timestamp, agent version, surface vitals (CPU/RAM/disk), pending tasks, recent alerts. Sort, filter, group by tag.

Dispatch tasks in two clicks

Pick a host (or many), pick a tool, fill in parameters, hit go. Track progress in real time. Drill into results with structured viewers — log files in a code reader, processes in a sortable table, registry trees in a navigator.

Config snapshot viewer

For any host, see its config across time: pick two snapshots and the diff tool highlights every change — new processes, removed software, version bumps, disk-space deltas. Catches drift instantly.

Alerts and daily summary

Threshold + change-based alerts. Acknowledge, snooze, or escalate. Daily summary email rolls up the day's signals so you don't have to live in the dashboard.

Operator-friendly

Command palette (Ctrl+Shift+K) for fast actions. Mobile-friendly responsive design. Real-time updates without polling — the dashboard subscribes to heartbeat events server-side.

CLI (pwa)

Scriptable, pipeable, automatable

18 commands

Everything the dashboard does, from your terminal. Perfect for scripting, CI/CD pipelines, ad-hoc ops:

Example session

$ pwa create DiskSpace --rnc CLIENT-001 --priority Alta
Task #1834 queued. ETA: 30s.

$ pwa view 1834
Status: completed
Result: C: 412 GB / 500 GB (82%) — warning threshold 85%

$ pwa schedule "0 */6 * * *" --tipo ConfigSnapshot --rnc CLIENT-001
Scheduled: every 6h. Next run: 2026-05-30 00:00:00.

Pipeable

Output is structured (JSON or table). Pipe into jq, ship to CI, render to whatever. The CLI is a thin client over the REST API — no special privileges, just an API key.

MCP Server

Drive your fleet from Claude Desktop

What is MCP?

The Model Context Protocol is Anthropic's open standard for connecting AI assistants to external systems. With PWA's MCP Server, Claude Desktop (or any MCP-compatible client) can read your fleet state and execute operations.

40+ PWA tools exposed

The most-used PWA capabilities are wrapped as MCP tools spread across nine modules (Tareas, Alertas, Clientes, Diagnostico, Playbooks, RemoteControl, Database, FTP, Chat). Each tool is typed with JSON Schema so the LLM knows exactly what it can do.

Dual transport

Auto-discovery

Tools are registered with the [McpServerTool] attribute and discovered automatically via .WithToolsFromAssembly(). Add a new tool by adding a method — no config to touch.

Sample config (Claude Desktop)

{
  "mcpServers": {
    "peopleworks-agent": {
      "command": "PeopleWorksAgent.MCP.exe",
      "args": ["--stdio"],
      "env": {
        "PWA_SERVER": "https://agent.acme.com",
        "PWA_API_KEY": "..."
      }
    }
  }
}
In practice: Open Claude Desktop, ask "any production hosts running below 1GB free RAM right now?" — Claude calls the right tools, aggregates, and answers. No dashboard click required.

Recurring Tasks

Cron-based scheduling, fleet-wide

Full cron expressions

Powered by NCrontab. The same 5-field syntax you already know: minute hour day month weekday. Schedule any tool to run on any host, on any cadence.

Examples

# Daily system snapshot at 6am
0 6 * * *  → SystemInfo  → CLIENT-001

# Every 15 minutes, disk check on prod tag
*/15 * * * *  → DiskSpace  → tag:prod

# Weekly playbook every Monday at 5am
0 5 * * 1  → playbook:weekly-audit  → all

Visible and editable

Every recurring task shows up in the dashboard with its next-run timestamp, history, and pass/fail rate. Edit the cron expression or pause the schedule without redeploying anything.

Catch-up vs skip

If the agent was offline when a job was due, the server can either replay it on reconnect or skip the missed window — configurable per schedule.

Built on the same plumbing

A recurring task is just a regular task on a timer. Same execution path, same logs, same audit. Nothing exotic to debug.

Watchdog

Proactive monitoring with auto-remediation

What's running today

PWA ships with a set of background watchdog services that continuously evaluate fleet state and fire alerts (and, where safe, remediations) without operator intervention:

Domain-specific watchdogs

Specific monitoring services target known patterns we operate against in production — for example, an NCF Sequencer watchdog tracks ranges of electronic invoice number sequences across the ERP fleet and alerts when a client is approaching exhaustion.

Remediation today

The agent's tools can be invoked directly from alerts (or from chat, or from playbooks) — TempCleaner, MemoryOptimizer, ErpGuardian, restart-service via PowerShell — so the "fix-on-trigger" pattern is feasible by chaining alert → playbook. Full configurable threshold→action rules are on the roadmap.

Audit trail

Every mutating action — taken by an operator, by chat AI, or by a service — is logged with the trigger, the action, the result, and the actor. Forensics are first-class, not bolted on.

Roadmap: a configurable rule engine (threshold / state / pattern triggers + composable remediations + per-rule cooldowns) is on the near-term roadmap. Today's watchdog set covers the most common failure modes; the engine generalizes it for custom signals.

Playbooks

Reusable workflows built from tools

Chains of tools

A playbook is an ordered sequence of tool invocations. Each step can pass data to the next, branch on the previous result, or short-circuit on failure. Think CI pipeline, but for ops on Windows hosts.

Built-in playbooks

Bring your own

Playbooks are JSON. Author them in the dashboard's visual editor or check them into your repo and POST them via the API. Either way, they live with the rest of your tenant config.

Run anywhere

Same playbook works from the dashboard ("Run on this host"), the CLI (pwa playbook morning-check --rnc XXX), the watchdog (as a remediation), or the AI chat ("run morning check on prod").

Config Snapshots

Track every host's state, spot drift instantly

What gets captured

A snapshot is a structured JSON document with everything that matters about the host's state:

When it runs

Diff viewer

Pick any two snapshots — from one host across time, or from two hosts at the same time — and see structured differences highlighted. New software in green, removed in red, version bumps in amber. Spot a misconfigured workstation in seconds.

Use cases

Interactive AI Chat

Talk to your fleet in natural language

OpenAI-compatible chat backend

The dashboard's chat uses an OpenAI-compatible chat-completions endpoint configured at the server level (model + base URL + auth token, all in appsettings.json). Swap providers by changing the config — the rest of the pipeline doesn't care whether you're pointed at OpenAI, Azure OpenAI, an internal endpoint, or a self-hosted model.

Per-client context, auto-injected

When you start a chat scoped to a host, the AI receives the host's recent snapshot, recent alerts, recent task results, and tags as system context. You don't have to paste anything — the AI already knows the situation.

Tool-using mid-conversation

The AI doesn't just chat. It can dispatch tools live. Ask "why is CLIENT-23 slow this morning?" and it'll pull CPU, memory, top processes, then reason over fresh data. Mutating tools (create task, resolve alerts, rename client) are audited in a dedicated table so every action the model takes leaves a trace.

Two surfaces

Conversation persistence

Chats are persisted server-side. Pick up where you left off, share threads with teammates, or audit what was discussed and what tools were invoked via the ChatAuditoria table.

Tag-Based Grouping

Organize the fleet however you think about it

Multi-tag per host

Each host can carry any number of tags. Tag by environment (prod, staging, dev), by customer (acme-corp), by region (dr-north), by role (file-server, terminal), or by anything custom you care about.

Computed status (alongside manual tags)

In addition to the tags you assign, every client surfaces computed state derived from its latest heartbeat — online / offline, last-seen, agent version, snooze status. The dashboard combines manual tags and computed state in the same filtering UI.

Bulk dispatch

Once your fleet is tagged, you stop thinking host-by-host. Run pwa bulk --tag prod --tipo SqlServerHealth and the task fans out across all prod hosts. Track per-host progress in real time.

Tag-level analytics

The dashboard rolls up metrics by tag: "how many prod hosts are below 90% healthy", "alert rate by region", "version distribution by customer". You get fleet-level insight without leaving the operator UI.

Your DB, Your Choice

PWA fits your infrastructure, not the other way around

Four supported backends

Same schema across all four

EF Core abstracts the differences. The migrations apply automatically on startup. Switching backends is a connection-string change.

Why this matters

White-label customers and on-prem deployments rarely look like one another. Letting them pick the DB they already operate removes a procurement battle. PWA shows up, fits in.

Connection string examples

# SQLite (default)
"Data Source=pwa.db"

# SQL Server
"Server=.;Database=PWA;Trusted_Connection=True;TrustServerCertificate=True"

# PostgreSQL
"Host=db.local;Database=pwa;Username=pwa;Password=..."

# MySQL
"Server=db.local;Database=pwa;Uid=pwa;Pwd=..."

White-Label Friendly

Run PWA under your own brand for your own customers

What's brandable today

Custom tools via the plugin pattern

Need a domain-specific tool to ship with your build? Implement IAgentTool in a class library, register it in DI, and it shows up everywhere — dashboard, CLI, MCP. No fork required, no protocol to learn.

Deployment model

White-label customers typically run their own PWA Server instance — on-prem, in their cloud account, or in a managed environment. That means each operator gets their own database, their own SMTP endpoint, their own Telegram bot, their own AI provider configuration. Full data path control without per-tenant gymnastics in the product.

What's not in scope today

A few things often associated with "white-label" are not built into PWA itself: per-brand email templates with localized strings, programmatic theme switching at runtime, and operator-vs-end-customer surface separation within the same instance. White-label deployments handle these by running their own server, not by configuration toggles.

Enterprise tier: White-label deployment support is included. We help with the install, the brand swap, and the first-month tuning. Talk to info@peopleworksservices.com for details.

Bulk Operations

One command, many hosts, one screen of results

Three targeting modes

Real-time progress, per host

The dashboard shows a live grid: each host as a tile, each tile lighting up as the task starts, runs, and completes. Click any tile to drill into its result without leaving the bulk view.

Failure handling

One host failing doesn't block the rest. The grid surfaces failures with the error message, and you can retry just the failed ones with one click — no need to re-dispatch the whole batch.

Common use cases

CLI example

# Disk-space check across all production hosts
pwa bulk --tag prod --tipo DiskSpace

# Refresh config snapshot on a specific customer's hosts
pwa bulk --tag customer:acme --tipo RefreshConfigSnapshot

# Emergency cleanup, fleet-wide
pwa bulk --all --tipo TempCleaner --priority Alta

Smart Alerts

Signal, not noise — multi-channel delivery

Three trigger types

Delivery channels

Per-tenant cooldowns

Every (host, rule) pair has a cooldown window. A flapping disk-usage condition won't dump 200 alerts in your inbox overnight — it fires once, then stays quiet until the cooldown clears.

Daily summary

One email per day per operator with everything that fired in the last 24h, grouped by severity and by host. Skip the noise during the day, get the full picture at 8am.

Operator workflow

Alerts have lifecycle: fired → acknowledged → resolved. Snooze for N hours, escalate to another operator, or attach a remediation note. Full audit trail per alert.

Adaptive Polling

Fast when busy, quiet when idle

The problem with fixed polling

A 30-second poll feels snappy for the operator, but it's wasteful when nothing's happening. A 5-minute poll saves bandwidth but feels sluggish when you actually want a task to run. You shouldn't have to pick.

The cadence ladder

The agent starts at 30 seconds. After each empty poll (no pending tasks), it steps down the ladder:

active       →   30s
quiet 1 min  →   60s
quiet 5 min  →    2m
quiet 15 min →    5m
quiet 1 hour →   10m

Any incoming task — dispatched manually, by playbook, or by watchdog — wakes the agent back up to 30s instantly.

Bandwidth math

An idle host on fixed 30s polling sends ~120 empty pings per hour. On adaptive polling, the same host sends ~6. For a fleet of 1000 hosts, that's the difference between ~50 MB/hour and ~2 MB/hour of backend traffic.

Per-tenant tuning

The default cadence is sensible, but every step is configurable per tenant. Some customers want 15s/30s/60s for super-responsive ops; others want 60s/5m/30m for low-bandwidth sites.

Auto-Update

Roll out a new agent across the fleet — automatically

How it works

Every heartbeat carries the agent's version. The server compares it against latest.json. If a newer build is available and the host's tags match the rollout policy, the agent pulls the new binary, swaps itself out, and restarts.

Staged rollout

You don't have to update everyone at once. Tag a few canary hosts as canary, point the rollout policy at that tag, watch it bake for 24h. If nothing breaks, widen to prod. Standard blue/green logic — but for agents.

Self-rollback on startup failure

Before swapping, the agent keeps a copy of the previous binary. If the new one fails to start within N seconds, it rolls back automatically. The dashboard surfaces failed updates so you can investigate without losing the host.

The publish flow

  1. Build a new single-file agent with publish-all.cmd
  2. Drop the EXE into the server's updates/ folder
  3. Bump version in latest.json
  4. Optionally set tag-based gating
  5. Agents update on their next heartbeat

No agent left behind

The dashboard shows version distribution across the fleet at a glance. Stragglers (offline at rollout time) update the moment they reconnect — no manual chasing.

Heartbeat-Based Health

Lightweight signal, full situational awareness

What the heartbeat carries

A small JSON payload every 60 seconds:

Online / offline detection

The server flags a host offline after 3 missed heartbeats (~3 min by default). Dashboard turns the indicator red, watchdog can fire an alert, recovery is automatic when the heartbeat resumes.

Server-side event triggers

Heartbeats aren't just data — they're triggers. The server can use them to fire alerts on "host came online unexpectedly", "version regression detected", "vitals crossed threshold", or anything you can express as a rule against the heartbeat stream.

Why not just polling?

Polling tells you "the agent is alive enough to ask for work". Heartbeats tell you "and here's what's happening on the host right now" — without the operator needing to dispatch a task. Two different signals, both cheap.

By design: Heartbeat is ~2 KB compressed. A fleet of 5,000 hosts at 60s heartbeat is roughly 10 KB/s of traffic — well inside any reasonable backhaul.

Remote View (VNC)

Eyes on the host when logs aren't enough

On-demand, no preinstall

You don't pre-install VNC on every host. The first time you need to see what's happening on a workstation, click "Start Remote View" in the dashboard. The agent fetches a portable TightVNC build, starts it on a randomized port, and the server tunnels you in. When you close, it stops and uninstalls — no leftover surface.

Time-limited sessions

Every session has a configurable lifetime (default 30 minutes). When it expires, the VNC server stops, the port closes, the dashboard logs the session end. No "I'll just leave this open" risk.

Auditable

Every VNC session is logged with operator identity, host, start time, end time, and reason (optional free-text). If your compliance regime asks "who looked at CLIENT-007's screen on Tuesday?", the answer is in the audit log.

Built for support, not surveillance

The end user on the host sees a clear notification when a session starts, with the operator's name. There's no covert viewing — this is meant for support engagements, not for watching people work.

Alternative for read-only

If you just need a screenshot, not a live session, use the capture_screen tool. It returns a PNG of the current desktop without opening a remote channel — much lighter touch.

Per-Client Configuration

Each host carries its own settings, alongside the rest of the fleet

Per-client settings on every host

How auth actually works

Each agent authenticates to the server with its client key (the RNC in PWA's reference deployment). The server validates the key against the registered clients table on every request — keys are scoped per-client, leaking one doesn't open the rest of the fleet.

Operator vs agent surfaces

Two layers of access: agents authenticate by client key on the public API, operators authenticate to the dashboard via PIN behind a middleware that whitelists agent endpoints.

Shared services (server-level)

Things like the SMTP server, the Telegram bot, and the AI Copilot endpoint are configured once at the server level and shared across the fleet. White-label deployments typically run their own server instance, so each operator gets their own set of these regardless.

On the roadmap: deeper per-client secret storage (encrypted at rest, audit log of reads, programmatic rotation) is planned for the Enterprise tier. Today's model favors simplicity — the server is small, the deployment is single-binary, and most fleets don't need the full secret-management surface.